PVcase Yield vs. PVsyst: a solar simulation comparison guide


EXECUTIVE SUMMARY
Executing a bankable solar energy yield assessment depends on matching the correct simulation engine to your specific site conditions. This comparative guide contrasts the physical, terrain-native framework of PVcase Yield directly against the traditional mathematical analytical pipeline of PVsyst to help you select the optimal tool.
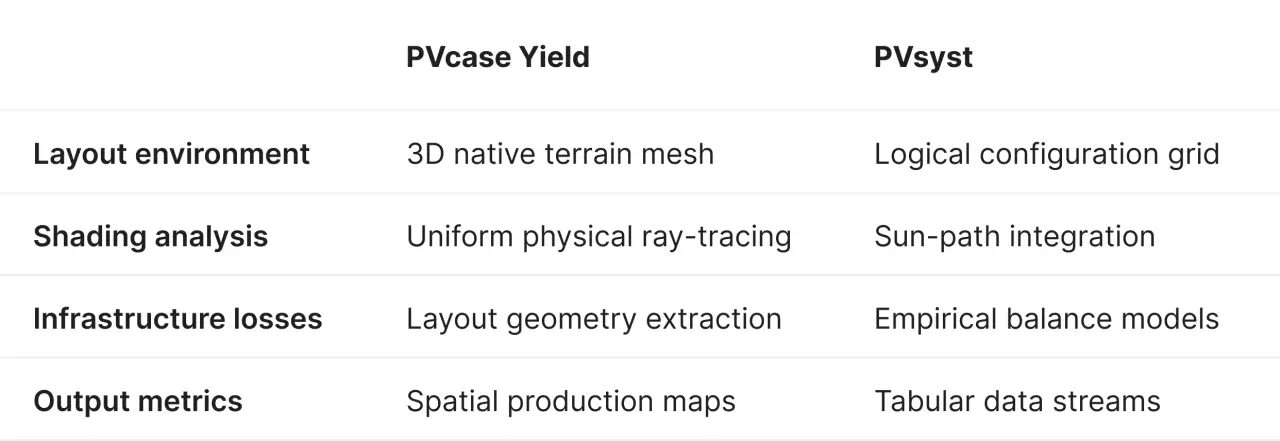
A side-by-side architectural layout of the distinct simulation mechanics utilized by each software package.
For solar professionals, accurate energy yield predictions are the bedrock of successful project development. Tools like PVsyst have long been the industry standard, but with the rise of advanced 3D modeling and ray-tracing capabilities, software like PVcase Yield is setting new benchmarks for precision. While both serve the critical function of simulating energy production, they approach the task with different methodologies and levels of detail in certain areas.
This blog post is your guide to understanding the nuances of how PVcase Yield and PVsyst handle various loss mechanisms. To help you choose the best solution for your needs, we have prepared a comprehensive, downloadable PDF — PVcase Yield vs PVsyst comparison. Download your copy today and get the clarity you need to make the right choice.
How to align data inputs and baseline configuration
QUICK TAKE
Irradiance calculation: PVcase Yield computes PoA natively via 3D terrain geometries, while PVsyst relies on mathematical transposition models.
Component specifications: Both tools share standard file formats.
Layout design mechanics: PVcase Yield models shading within an exact 3D layout environment. PVsyst bases simulations on abstract logical architecture mapped onto simplified 3D scenes.
The foundation of any simulation lies in its models, and any simulation is only as accurate as its inputs. Before diving into output comparisons, ensure that the fundamental parameters are as consistent as possible between PVcase Yield and PVsyst. However, it's crucial to understand how each solution process or interpret this data.
How do geographical and weather data compare between platforms?
PVcase Yield is tightly integrated with the 3D design environment, leveraging the detailed site model to conduct high-fidelity PoA irradiance calculations based on precise module placement data and a comprehensive sky radiance distribution model. It also supports direct integration with PVGIS and SolarAnywhere, while enabling users to manually upload custom climate files from other sources.
PVsyst integrates with various climate data sources (such as PVGIS, Meteonorm, SolarAnywhere, and Solargis), and also enables users to import and process their own weather data from meteorological stations. A simulation requires the selection of a weather file that defines hourly values for global horizontal irradiance (GHI), direct normal irradiance (DNI), diffuse horizontal irradiance (DHI), temperature, and wind speed. PVsyst's then uses a transposition model to calculate plane-of-array (PoA) irradiance.
Key comparison point: verify the source and consistency of the weather data. When comparing simulations, it is crucial to ensure the exact same climatic input data is used in both software tools. The best way to achieve this is to use the '.MET' import feature in Yield, which allows you to read the identical data file used in PVsyst.
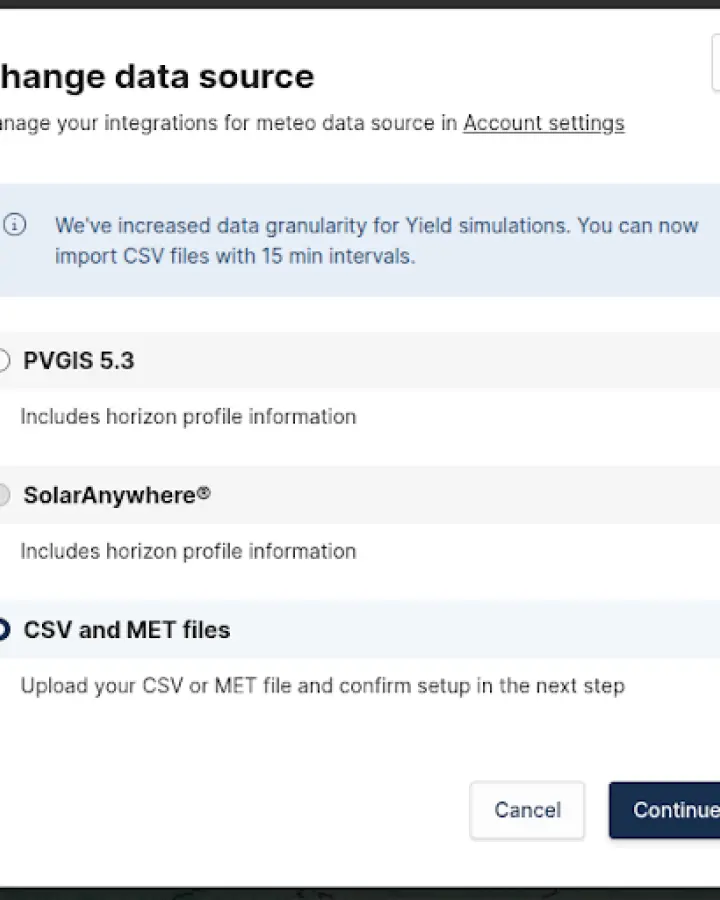
The data import window within PVcase Yield used to standardize environmental variables across platforms.
Matching module and inverter specifications
Over the years, the PV industry has adopted PVsyst file formats for describing PV modules (.pan files) and inverters (.ond files) technical specifications. PVcase Yield has also adopted this standard and allows users to upload the same files they used to use in PVsyst.
Key comparison point: while seemingly straightforward, ensure the exact same .pan and .ond files for the same models and manufacturers are selected. Subtle differences in temperature coefficients, IAM (incidence angle modifier) profiles, or inverter efficiency curves (e.g., partial load efficiencies) can lead to variations. Check if one solution uses a simplified model versus a more detailed one for a specific component.
Benchmarking system sizing and configuration
PVcase Yield excels in the physical, spatial design. Its strength is in precisely placing modules in 3D space, defining row spacing, tilt angles, and stringing within a visually accurate environment. This directly feeds into its shading calculations.
PVsyst is more focused on enabling users to define the system architecture without requiring a detailed PV layout or design. While it has 3D modeling capabilities, its initial setup often begins with defining the number of modules, strings, and inverters, then placing them within its simulation environment.
Key comparison point: ensure the total installed DC capacity, modules per string, and strings per inverter are identical. Most importantly, carefully compare the physical layout parameters such as inter-row spacing, ground coverage ratio (GCR), and tilt/azimuth angles. PVcase's exact 3D representation will directly inform its calculations of these parameters.
Why do solar loss mechanisms and environmental models differ?
QUICK TAKE
Shading analysis: PVcase Yield applies ray-tracing while PVsyst uses sun-path geometric integration and simplified assumptions for back-side bifacial modeling.
Thermal distribution: Both tools use single-diode modeling based on .pan inputs. PVsyst applies two empirical heat loss constants, while PVcase Yield leverages spatial orientation and structure ventilation differences.
Electrical infrastructure: PVsyst models DC wiring and mismatch using detailed length, gauge, and degradation variables. PVcase Yield extracts geometries from the electrical design layout.
Inverter processing: Both platforms parse efficiency curves using identical .ond configurations.
Both PVcase and PVsyst account for various loss mechanisms, but their underlying calculation methodologies and the granularity of their models can differ significantly. This is often the primary source of discrepancies in the final energy yield.
How does 3D physical ray-tracing compare to sun-path geometric integration?
PVcase Yield's core strength and advantage lie in its precise and robust 3D modeling capabilities. Shading calculations in PVcase Yield are typically based on a highly accurate ray-tracing approach derived directly from the detailed 3D site layout. Furthermore, it employs the same method to calculate irradiance and shading on both the front and back sides of the PV modules. This allows for very granular analysis of self-shading, near shading from obstructions (buildings, terrain), and far shading (mountains, horizon).
PVsyst: offers 3D shading analysis. It builds a 3D scene from defined objects (rows, fences, trees, terrain). PVsyst's approach calculates hourly shading factors for each module or array, often using a combination of geometrical calculations and numerical integration over the sun's path. However, the back-side irradiance and shading calculations are considerably more simplified compared to the front side and rely on a greater number of assumptions. It can model both irradiance and electrical shading (mismatch) losses and electrical shading losses.
Key comparison point: this is a critical area. PVcase's detailed 3D output for a specific design might show more precise or localized shading effects. In particular, back-side irradiance calculations may show notable differences, given that the PVsyst method is based on numerous assumptions.
Ensure both tools are set up to capture the same shading objects and methodologies (e.g., if one is set to ignore certain far shading while the other includes it). Pay attention to how electrical mismatches due to shading are modeled, as PVsyst provides multiple approaches with different levels of detail to address this.
The impact of differing temperature models and thermal loss constants
PVcase Yield: its integration with the physical design might implicitly influence how module temperatures are distributed across the array, especially if there are ventilation differences due to mounting structures.
PVsyst: estimates the module temperature using an energy balance model with two empirically derived heat loss coefficients. This approach allows users to fine-tune the thermal model when module temperature measurements from the PV plant are available.
Both solutions: rely on the single diode model to calculate thermal losses, using parameters such as the thermal coefficients that are specified in the .pan file.
Key comparison point: ensure that the thermal coefficients in the .pan files are consistent and that the empirical heat loss coefficients are appropriately selected.
Comparing DC cabling geometries and electrical string mismatch factors
PVcase Yield: can incorporate stringing and cable length details from the plant's electrical design to precisely model wiring and electrical mismatch losses. However, if only a mechanical layout is available, it relies on user-defined estimates to estimate mismatch losses.
PVsyst: offers detailed models for DC wiring losses based on wire lengths and gauges, and a range of models with varying levels of complexity and accuracy to account for electrical mismatch within strings and between strings due to manufacturing tolerances, partial shading, or degradation.
Key comparison point: ensure comparable percentages or calculation methods for these electrical losses. If PVsyst models mismatch in more detail, try to map that to a general percentage or set of assumptions in PVcase, or understand why PVsyst calculates a higher value.
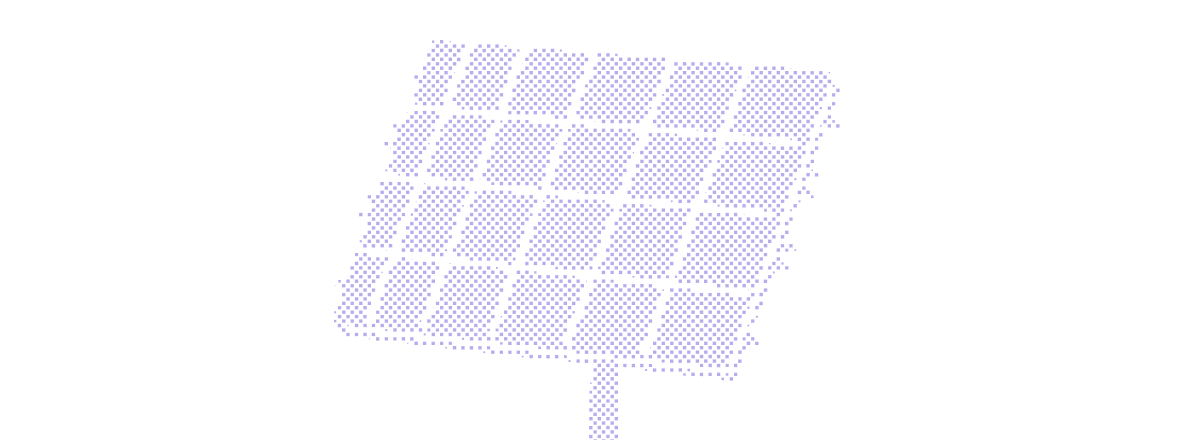
.png/2169f503a68903a7f9a79bcc3aa05cbd/image-(26).webp)
The native physical 3D ray-tracing workspace in PVcase Yield displaying simultaneous terrain, environmental, and electrical data layers.
How do inverter losses compare between platforms?
PVcase Yield: provides detailed modeling of clipping, derating, and conversion efficiency. Badly sized inverters can be detected through high inverter losses using Yield's intuitive loss diagram.
PVsyst: provides detailed modeling of the inverter’s voltage window, current limiting, and clipping. It assists users with inverter sizing and offers a comprehensive breakdown of inverter-related losses.
Both solutions: use inverter efficiency curves from the .ond file.
Key comparison point: ensure that the specifications in the .ond files are consistent and that the inverter sizing in PVcase Yield is appropriate.
How does PVcase Yield’s energy output metrics compare to PVsyst?
QUICK TAKE
Performance ratio mapping: PVcase Yield calculates a self-adjusting AC performance ratio. PVsyst provides separate standard and bifacial PR values but excludes horizon and terrain losses.
Granular output reporting: PVsyst breaks down datasets into detailed monthly intervals and sub-hourly intermediate metrics. PVcase Yield utilizes its 3D environment to map and display spatial production.
Loss diagrams/tables: Both platforms categorize and sequence loss tables differently (e.g., rear-side IAM inclusion variations).
Beyond the total annual energy yield (kWh/year), compare other key performance indicators that can shed light on the simulation differences. The way each solution reports these can also vary.
How does the Performance Ratio (PR) calculation compare?
Both tools use similar calculation methodologies, but there are some differences to keep in mind.
PVsyst presents two distinct values: the traditional "Perf. Ratio PR" and the newer "Bifacial perf. ratio."
PVcase Yield, however, automatically adjusts its calculation based on the module type and reports a single "AC performance ratio."
When evaluating simulations, it is essential to map Yield's metric to the corresponding PVsyst PR value for your specific system type. Furthermore, the treatment of specific loss factors differs; PVsyst excludes horizon and terrain-shading losses from its PR calculation, which can lead to a slightly lower reported PR compared to PVcase Yield and field measurements.
Comparing specific yield
Specific yield, measured in Kwh/kWp, is a common metric for both platforms.
Comparing periodical production simulations
Both software provide hourly and sub-hourly time-series simulations and annual energy summaries.
PVsyst: offers more detailed monthly breakdowns and includes additional intermediate calculations within its hourly data.
PVcase Yield: reports the spatial performance distribution due to its 3D modeling capabilities.
Reconciling loss diagram structures between platform dashboards
both solutions provide a breakdown of losses, but their categories and the order of calculation might differ. Carefully map each loss category from one tool to the other to understand where divergences occur. For example, PVsyst may report the "Incidence Angle Modifier" only for the front side of the modules, whereas PVcase Yield might provide it for both the front and rear sides.
Why should you compare absolute energy yield in MWh?
A crucial point to remember when comparing loss figures, especially those expressed as percentages, is their reference point.
The same absolute loss in MWh might appear as different percentages if the baseline (e.g., plane-of-array irradiance vs. DC nominal power) differs between the tools. In scenarios where percentage-based comparisons become ambiguous due to varying baselines, it can be more insightful to directly compare losses in absolute units, such as MWh, to get a true picture of their impact on the final energy yield.
How to choose between PVcase Yield and PVsyst
Ultimately, the key to comparing simulation results between PVcase Yield and PVsyst isn't just about finding the exact same number, but about understanding the journey of how that number was reached. As this analysis shows, while both solutions excel in their respective domains, the nuances in their methodologies can lead to meaningful differences.
PVcase Yield's 3D-first approach, particularly in complex shading calculations and spatial performance reporting, provides a detailed, granular view that is invaluable for projects where site specifics directly influence yield.
By leveraging the same inputs and meticulously comparing the outputs, engineers can reconcile differences and build confidence in their modeling. In an industry where accurate energy modeling is paramount, knowing which tool is best suited for your specific needs — and why — is the ultimate advantage.
Download the full PVcase Yield vs PVsyst comparison guide and choose the best solution for accurate solar project energy prediction.
Book a personal demo
Find out how to get precise yield projections for any PV technology or site, eliminating manual workarounds and guesswork at every project stage.