Blog
PVcase product updates: spring edition
March 25, 2026
PVcase Products


PVcase Summer Updates are here, bringing faster workflows, enhanced 3D capabilities, and greater modeling accuracy across PVcase Prospect, PVcase Ground Mount, and PVcase Yield.
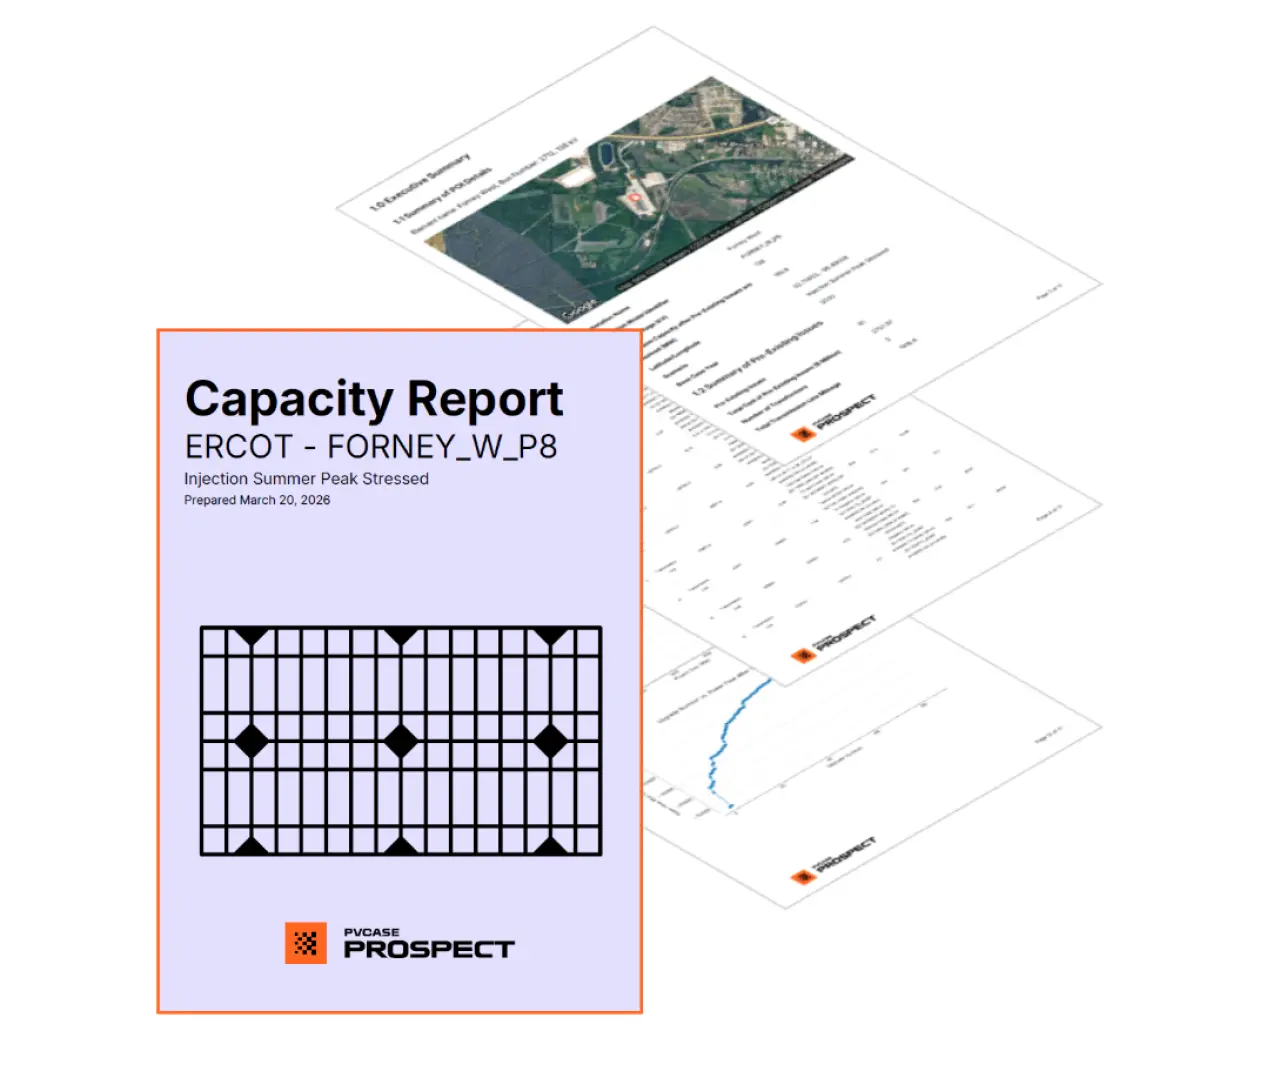
Generate and analyze multi-scenario capacity reports instantly.
You can now generate Capacity Reports directly from the Evaluate Capacity sidebar's Total Cost flow. This direct integration is a streamlined enhancement that enables users to efficiently analyze the Total Cost of Upgrades for a Point of Interest (POI) across multiple scenarios.
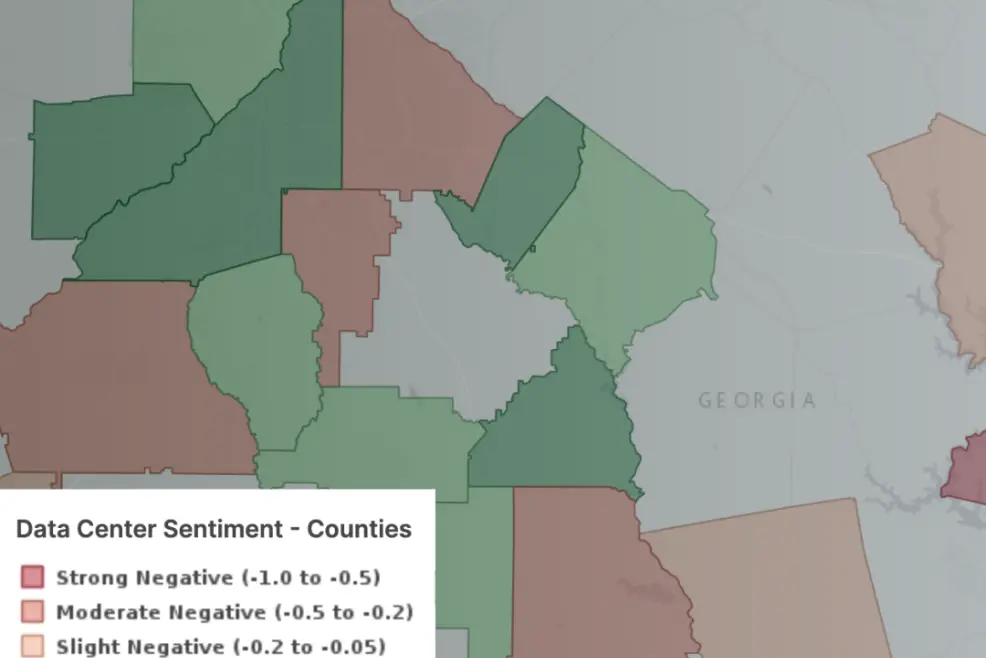
View operational fiber and gas infrastructure overlaid directly onto local parcels.
Site selection just got much faster with the seamless integration of RexTag fiber and gas data into your parcel searches. You can now filter parcels by their proximity to operational assets, set configurable distances (e.g., 0.5 miles), or search within custom-drawn polygons. This eliminates tedious manual workarounds, such as adding non-viable parcels to projects just to cross-reference separate datasets, thereby significantly reducing time-to-shortlist.
.png/a442bbeef21d8d1b16774fc6b4e1f112/pros_automated_pipeline_hazards_for_buildable_area_analysis_(baa).webp)
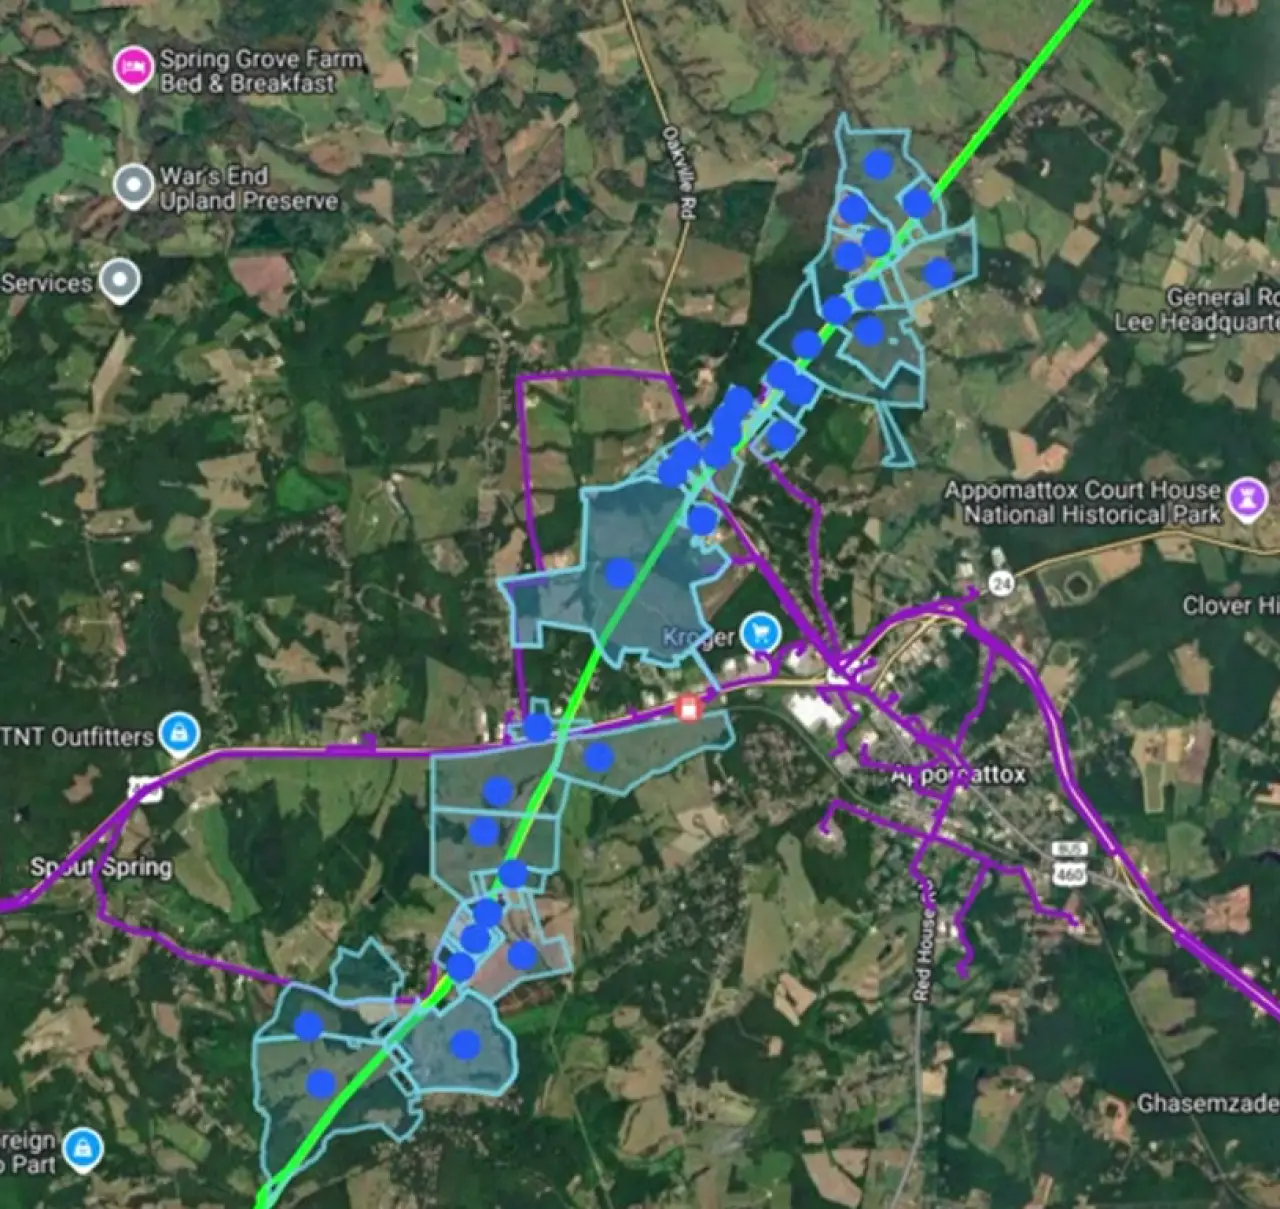
Configure custom setback distances and set specific hazards in the buildable area analysis menu.
Rextag pipeline data is now integrated into the Buildable Area Analysis (BAA), providing specific hazard settings and setback controls based on pipeline commodity types and operational status (e.g., distinguishing between "Operational" and "Abandoned"). By automating this process, developers and site feasibility analysts completely eliminate the need for manual pipeline tracing, resulting in highly accurate site maps and buildable area calculations.
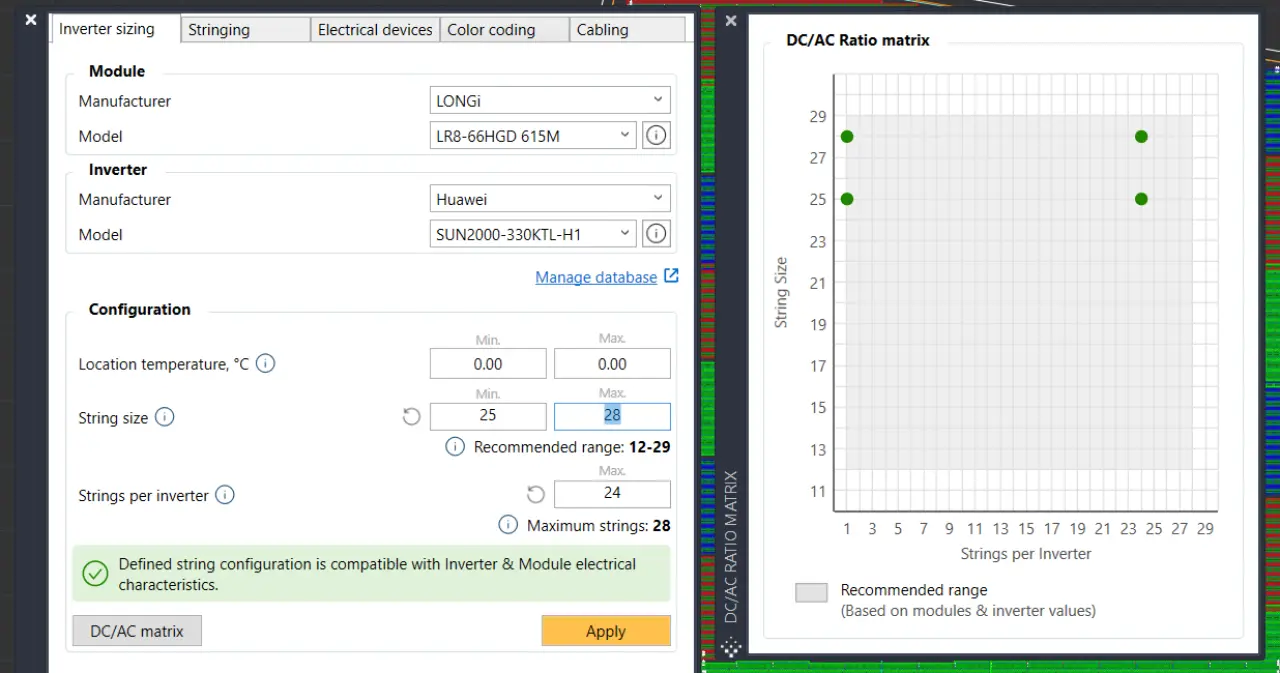
Instantly verify PV module and inverter compatibility.
You can now check the compatibility between PV modules and inverters directly within PVcase Ground Mount. The update centralizes the sizing process into a streamlined workflow, eliminating the need for other tools or manual spreadsheets. Furthermore, our new compatibility tool accounts for detailed electrical characteristics, MPP distribution, and localized temperature conditions to ensure significantly more accurate string sizes, electrical design settings, and cabling parameters.
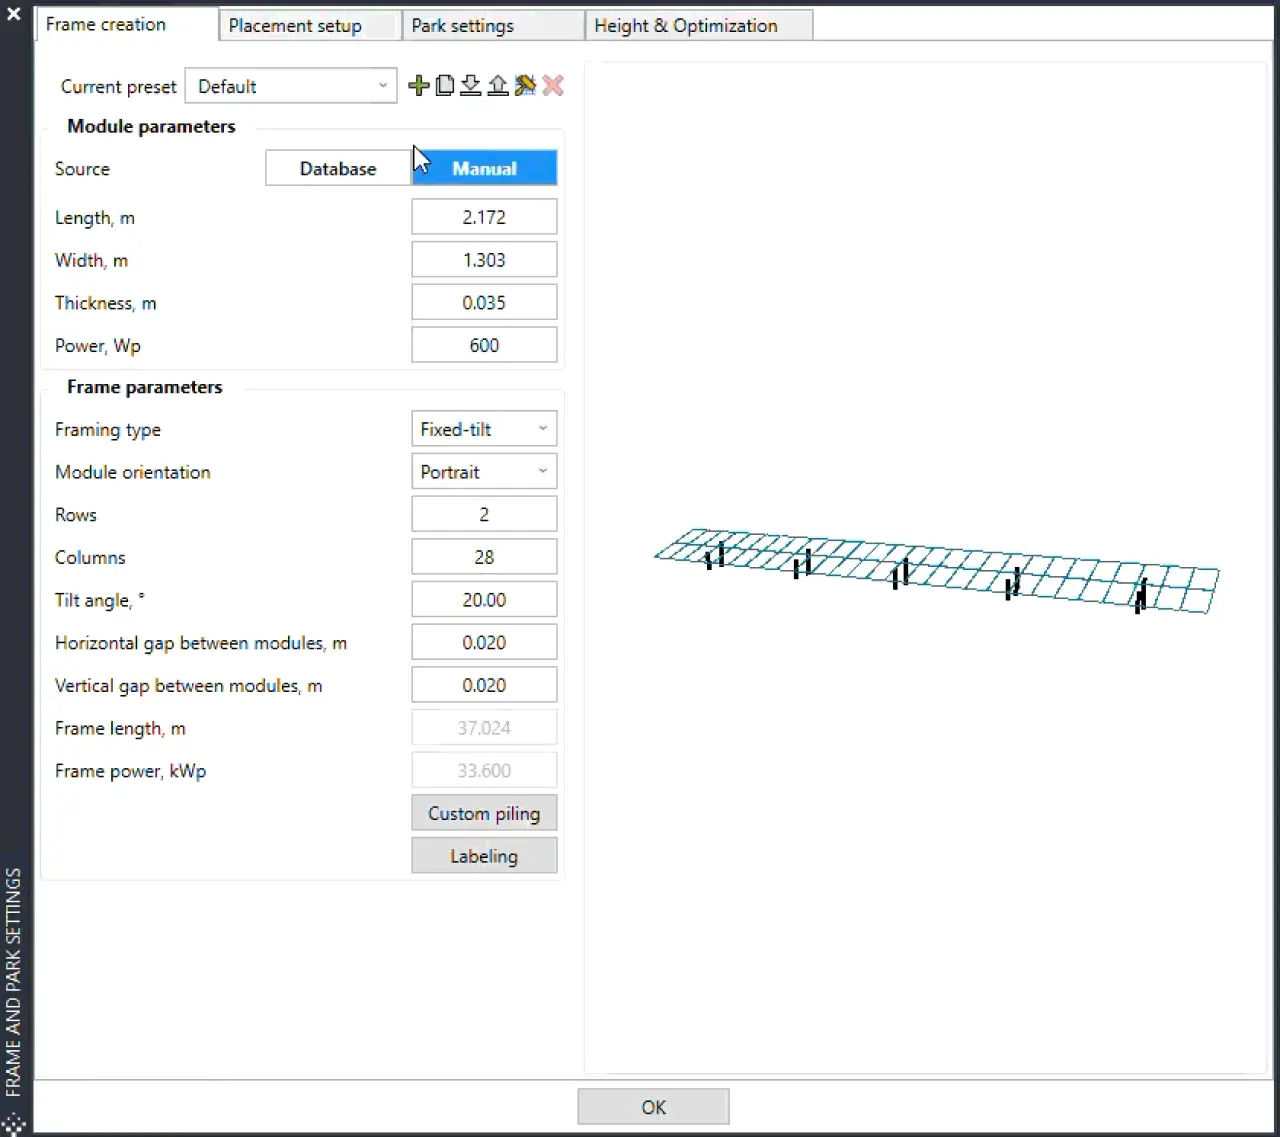
Pull certified, real-time specifications from a central cloud database.
You can now pull certified, real-time data for modules and inverters directly into your project from a centralized cloud database. The update centralizes approved equipment specifications into a unified platform, eliminating abstract guesswork and reliance on external workarounds like shared spreadsheets. Furthermore, our new automated component selection realistically calculates your needs to ensure a 50% faster workflow and significantly more accurate engineering outputs across all teams
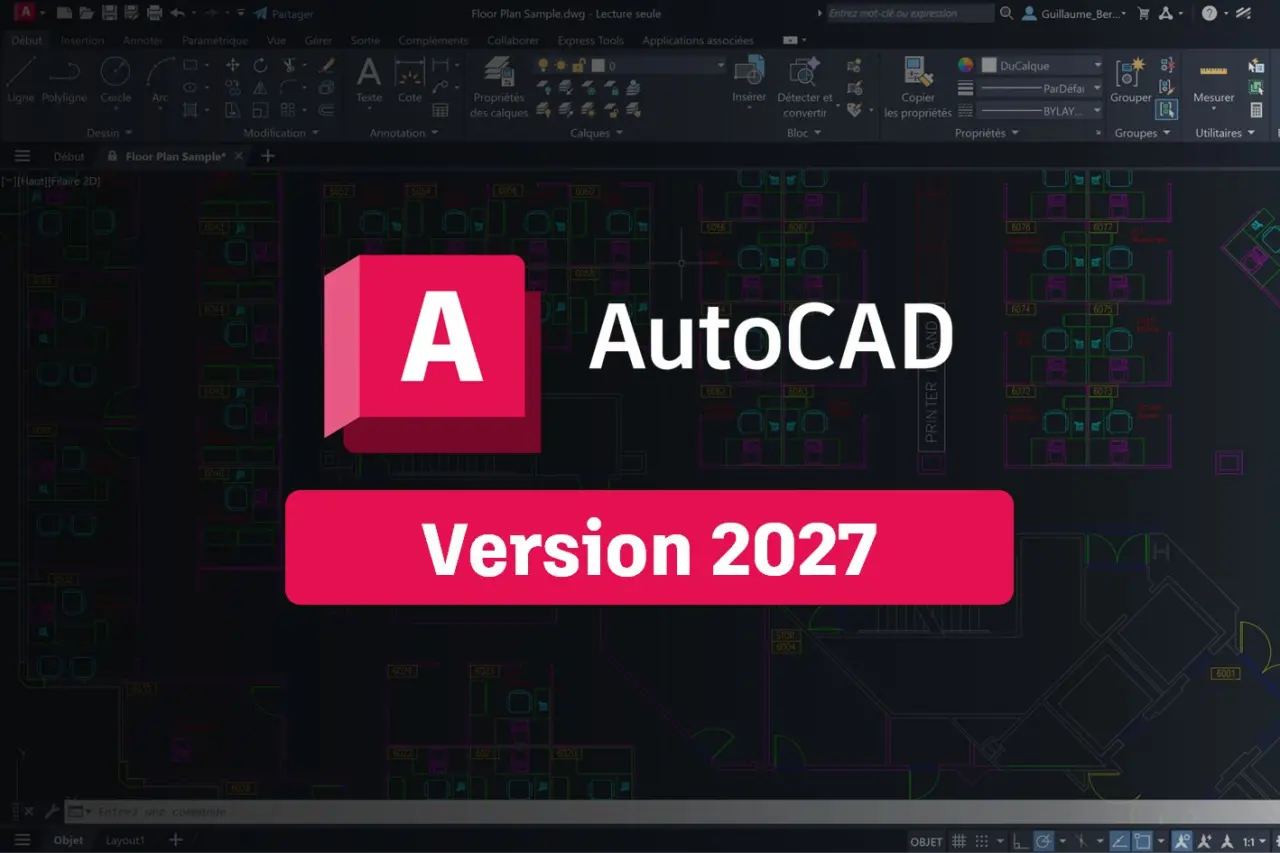
PVcase is compatible with AutoCAD 2027. Adopting the latest 2027 release doesn't mean leaving your old workflows behind, as we proudly maintain legacy support for AutoCAD 2026 and earlier versions.
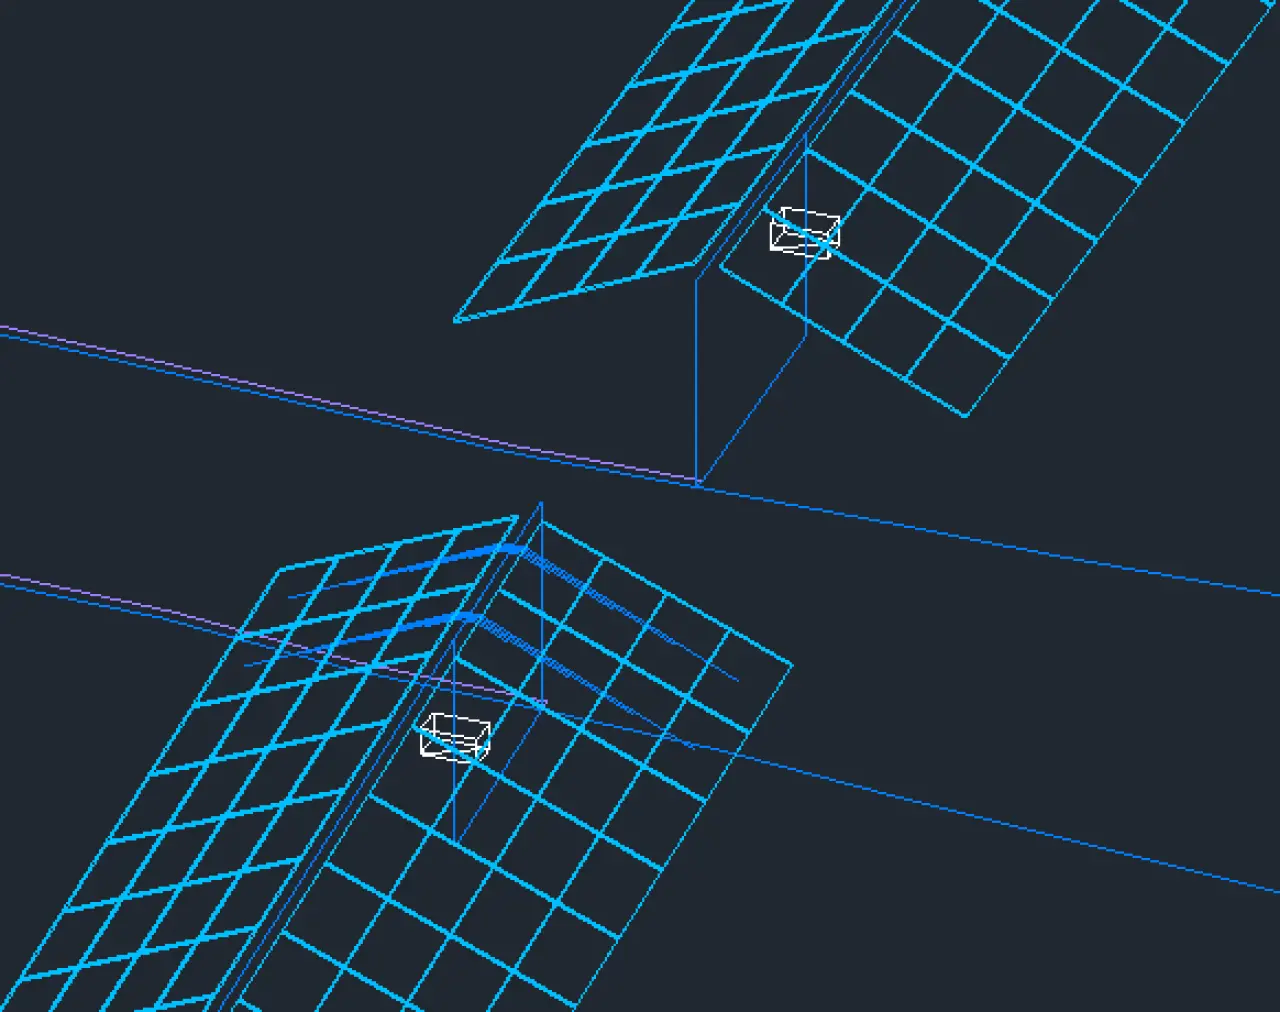
Visualize electrical infrastructure as 3D blocks mounted directly on frame piles.
You can now transform inverters, DC combiners, and AC combiners into elevated 3D blocks mounted directly on frame piles. The update centralizes device setup into a unified Configuration Modal with visual previews, eliminating abstract guesswork. Furthermore, our new 3D-aware cable routing realistically calculates both horizontal and vertical segments to ensure significantly more accurate Bill of Materials (BOM) and cable sizing outputs.
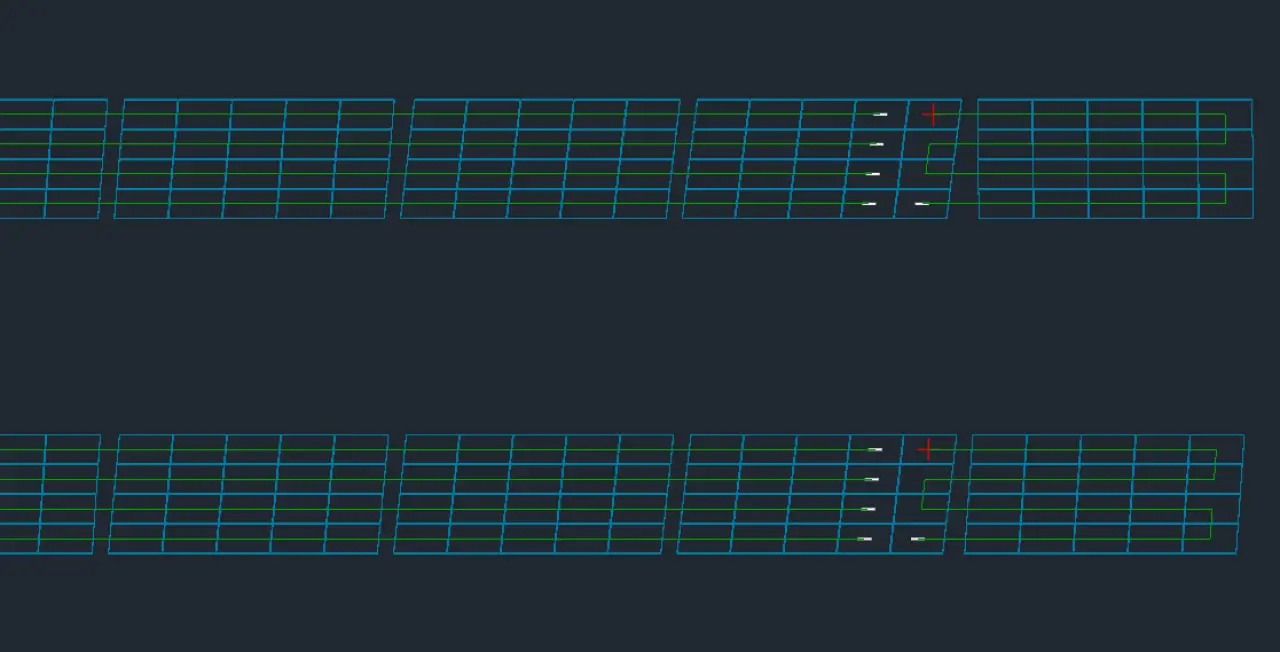
Eliminate electric design inefficiencies using continuous stringing tools.
Our new continuous stringing feature automates the electrical design process by populating rows based on your defined minimum and maximum string sizes. When encountering tricky leftover modules, the system seamlessly manages them by allowing you to leave them unstrung, draw S or U-shaped strings, or jump to the next row. By automatically prioritizing larger string sizes, this feature provides built-in cost optimization to keep your designs as efficient and cheap as possible.
When exporting a KML file from PVcase Ground Mount, the software now preserves your specific layer and object colors. This distinct visual clarity carries over seamlessly into viewing tools like Google Earth, making your exported designs and proposals much easier for stakeholders to navigate, recognize, and interpret.
Please note: These features are available starting with version 2.62. Be sure to update PVcase Ground Mount to access them.
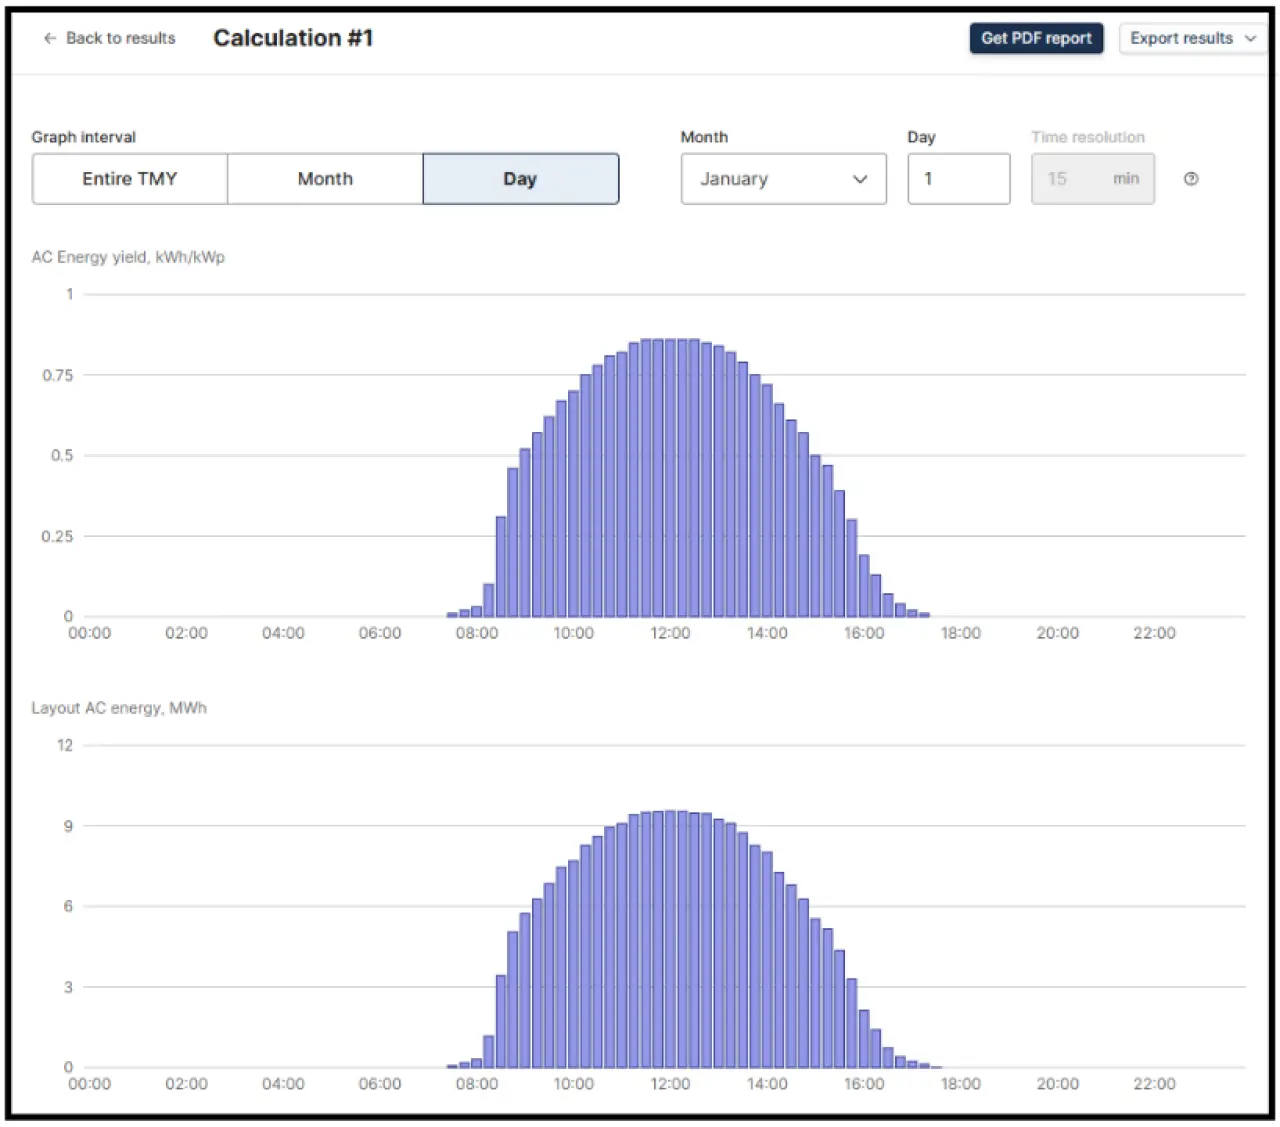
Model energy output with sub-hourly accuracy using 15-minute resolution metrics.
Model solar energy production with unprecedented accuracy by uploading custom CSV weather files containing 15-minute interval data (35,040 rows per year) directly into PVcase Yield. Powered by a fast cloud-computation engine that effortlessly handles massive datasets without slowing down your computer, this feature is critical for avoiding underestimated inverter clipping. It provides the granular precision needed for accurate battery dispatch modeling and complex system designs with high DC/AC ratios.
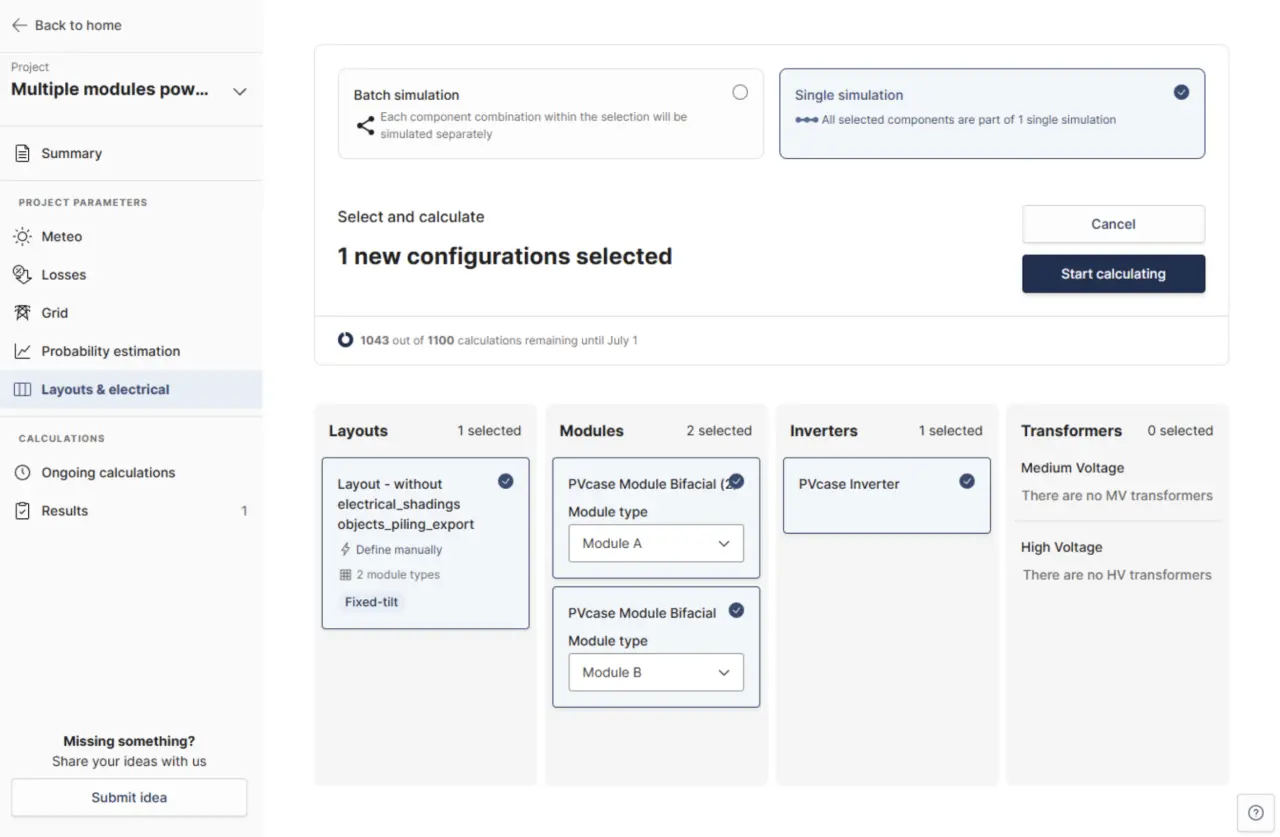
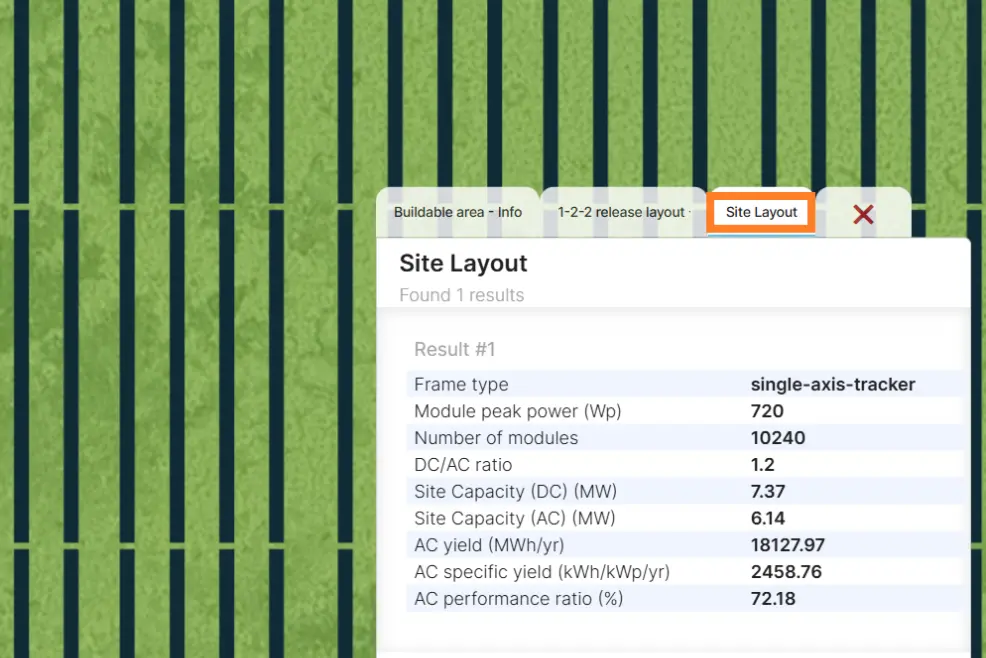
Run yield simulations containing multiple tracking module types simultaneously.
You can now define multiple module types within a single layout and run a unified simulation to assess their combined performance. This effectively eliminates the tedious workaround of splitting a project into separate files and manually recombining the data, accurately reflecting real-world design constraints like supply shortages or space optimization.
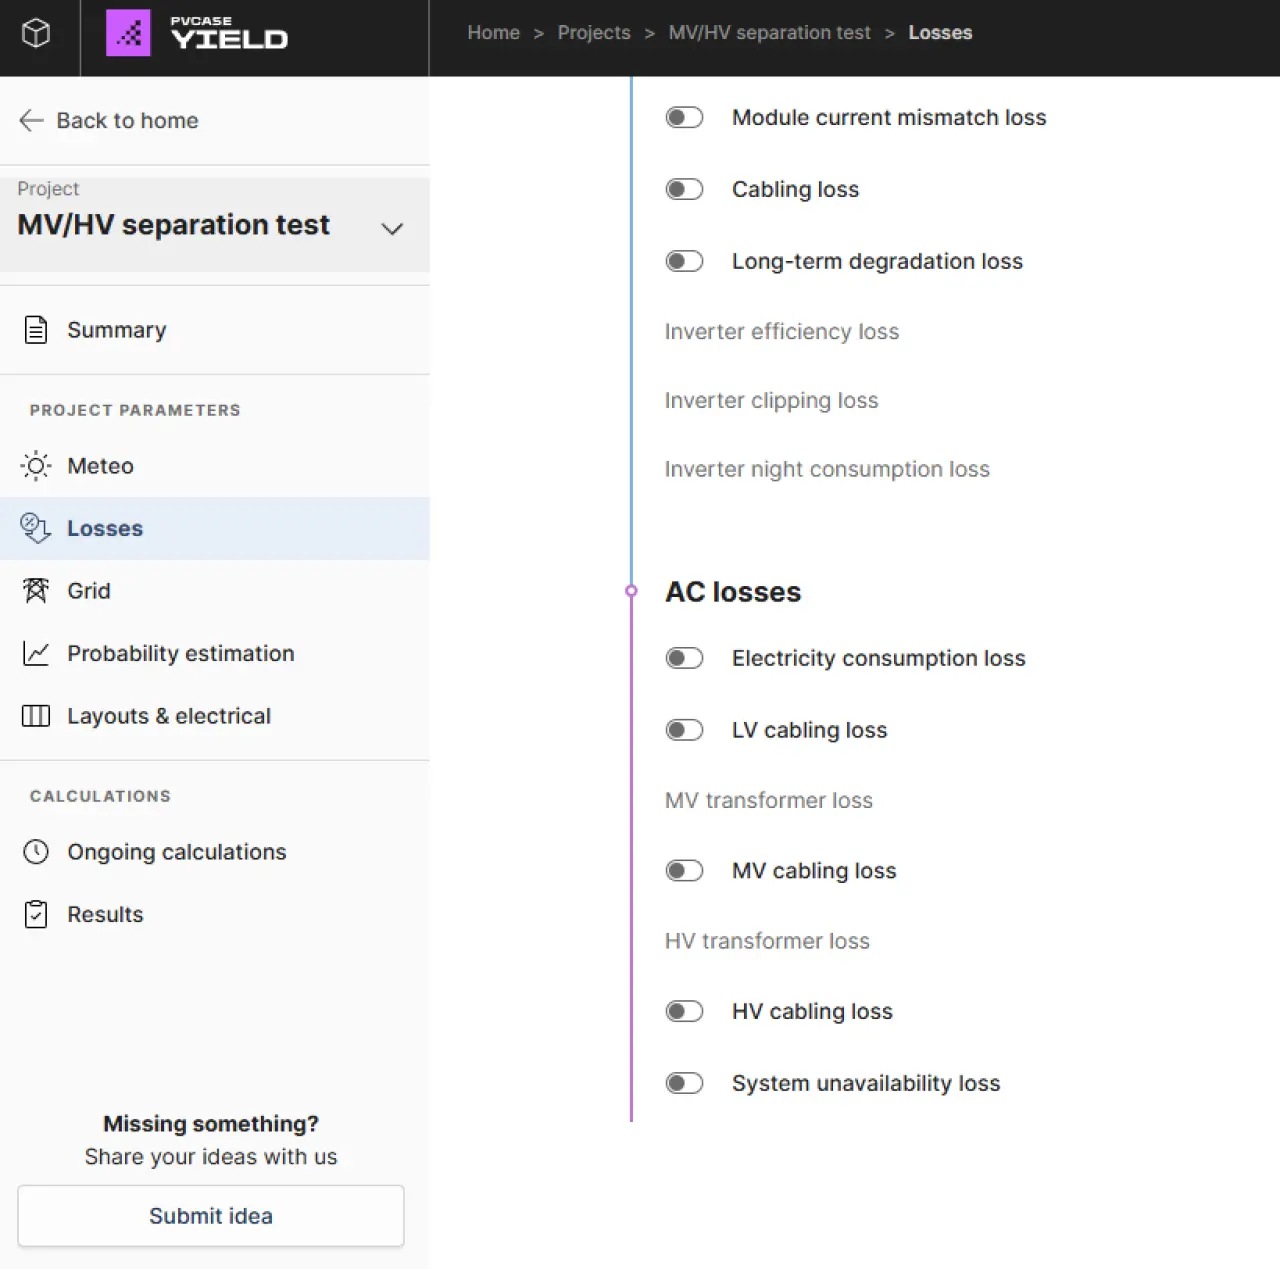
Model your design's AC losses with higher precision configuring MV and HV stages independently.
We have enhanced post-inverter AC loss modeling by decomposing the loss chain into distinct, independently configurable Medium Voltage (MV) and High Voltage (HV) stages. Users can independently define MV and HV transformers and toggle specific losses for MV/HV cabling. To ensure smooth sailing, the system also actively validates compatibility across your inverters and transformers to prevent voltage configuration errors.
Level up your next project — book a personalized meeting to move solar forward.
.png/5c5b8d09d5220fb81691ed0ef8e4536a/7_rm_layout_fix_tilt_frame-(1).webp)