Irradiance is the primary variable in solar energy production. It determines the size, cost, and layout of a PV plant. Without accurate irradiance data, developers risk underperforming systems, improper hardware sizing, and unbankable financial models.
Solar irradiance calculator: How to measure your site's solar potential


Max HailerContent project manager
March 17, 2026
PV Insights
Summary
Evaluating solar potential begins with calculating solar irradiance—the sun’s radiant power over a specific area. This guide details measurement techniques, instrument classes (ISO 9060), and mathematical models required to translate raw irradiance data into bankable energy yield projections for developers.
Understanding how to calculate solar irradiance is a foundational step in evaluating any potential site. This guide breaks down exactly what solar irradiance is, the instruments used to measure it in the field, and how developers can translate raw data to predict and optimize energy yield for bankable projects.
What is solar irradiance and why does it matter?
Summary
Solar irradiance measures instantaneous power (W/m²), distinguishing it from solar insolation, which tracks energy over time. It serves as the baseline for all PV development, directly dictating hardware selection, site layout, and the accuracy of financial yield simulations.
Accurately calculating solar irradiance is foundational to the success of any solar installation. Solar irradiance functions as the fundamental measure of the sun’s radiant power over a given surface area.
Solar irradiance, which represents instantly accessible power over a given area, should not be confused with solar insolation, which measures the total volume of solar energy over a given time frame. While the latter is typically expressed as kilowatt-hours per square meter (kWh/m2), the solar irradiance value is generally shown as time-independent watts per square meter (W/m2).
Put simply, calculating solar irradiance is the baseline for project development, directly influencing hardware decisions, optimal layout design, and precise yield analysis.
Key takeaways for developers:
Distinguish Power vs. Energy: Irradiance is the "rate" (W/m²); Insolation is the "total" (kWh/m²).
Baseline for Hardware: Inaccurate irradiance data leads to poorly sized inverters and sub-optimal stringing.
Financial Impact: Bankable projects require high-fidelity irradiance data to reduce "Basis Risk" for investors.
Types of solar irradiance
Summary
Understanding the differences between Direct Normal (DNI), Diffuse Horizontal (DHI), and Global Horizontal (GHI) irradiance is vital. These components are combined to calculate Global Tilted Irradiance (GTI), which reflects the actual light striking tilted PV modules.
There are several ways to take a solar irradiance measurement, and most projects will use a combination of approaches when looking to develop bankable estimations and project design. Common tests include:
Direct Normal Irradiance (DNI)
Direct solar irradiance is the amount of solar radiation received over a per unit surface area directly from the sun’s radiance, unobstructed by clouding or atmospheric diffusion. It is the simplest measurement, taken in a straight perpendicular alignment from the sun.
This calculation is critically important for Concentrated Solar Power (CSP) systems and single-axis tracker systems that maximize yield by tracking the sun’s trajectory throughout the day.
Diffuse Horizontal Irradiance (DHI)
Diffuse horizontal solar irradiance is used to calculate the solar radiation that does not follow a direct path from the sun to the target area, but instead has its path disrupted by atmospheric or weather-based obstacles.
This type of light is heavily affected by meteorological conditions such as high humidity or heavy clouding, and a solar installation’s capacity to capture DHI is what allows it to continue generating power even under challenging overcast conditions.
Global Horizontal Irradiance (GHI)
Total Global Horizontal Irradiance (GHI) is calculated by accounting for both direct and diffuse light sources. As such, it often functions as the foundational metric for total yield potential calculations over flat-surface PV installations, such as those designed over straightforward rooftop layouts.
This type of solar irradiance is calculated with the following equation:
DNI x cos (zenith angle) + DHI
Mathematically expressed as the sum of direct irradiance (adjusted for the angle between the sun’s rays and the vertical) and diffused irradiance.
Horizontal vs tilted surface irradiance
While GHI offers an important baseline, more complex or larger, utility-scale projects are almost never installed over perfectly flat areas. Global Tilted Irradiance (GTI) is a more comprehensive solar irradiance formula that also accounts for the specific angle of the panels. To this end, it can provide a more accurate reflection of true project potential.
A panel’s orientation can significantly alter the received irradiance and accurate GHI, DNI, and DHI measurements, alongside ground reflectivity (albedo), are all necessary to calculate the GTI. By extension, this measurement can be crucial for optimal yield modeling.
Key takeaways for developers:
GHI vs. GTI: GHI is for flat surfaces; GTI is essential for tilted panels and utility-scale projects.
Sensor Selection: DNI requires trackers (pyrheliometers), while GHI uses static pyranometers.
Albedo Matters: Rear-side irradiance (albedo) is critical for bifacial module gain in modern site assessments.
How to calculate solar irradiance
Summary
Mathematical modeling uses the inverse square law and planetary geometry to predict irradiance. Advanced models account for the solar zenith angle and atmospheric diffusion, using isotropic or anisotropic transposition to simulate how light interacts with tilted solar arrays.
The solar irradiance equation
Solar irradiance to power calculations are governed by the inverse square law for solar radiation. That is, the measurement by which the concentration of energy decreases the greater the distance from the sun.
Irradiance (typically measured in W/m2) is therefore calculated using the following formula:
Gsc x (1 AU / d)2
Here, Gsc represents the typical solar irradiance received at the top of Earth’s atmosphere (the average solar irradiance is approximately 1361 W/m2). 1 AU represents the average distance between the Earth and the Sun (approx. 150 million km). However, because the Earth operates on an elliptical orbit, seasonal variations in distance must also be accounted for at different points of the year (d/distance).
Solar irradiance formula for tilted surfaces
Translating this data into a more accurate representation of physical conditions for a solar array often requires calculating for a tilted surface. This involves modeling the solar zenith angle and azimuth (directional origin of irradiance) to determine how sunlight strikes the array.
Total solar irradiance by location is the sum of three components: direct beam (DNI), diffuse light (DHI), and ground-reflected radiation.
PV-design engineers typically use one of two transposition models for this calculation: isotropic models (which assume uniform diffuse radiation) or anisotropic models (which account for circumsolar and horizon brightening).
However, these traditional methods of modeling often fail to accurately capture real-world conditions over uneven or large-scale terrains where widely varying irradiance patterns are likely. For utility-scale precision, modern simulation models utilize physics-based ray tracing technology to simulate exact shading and irradiance conditions over complex topographies.
Irradiance calculation example
So, how to calculate total solar irradiance? Let’s consider a sample calculation for a solar panel with a tilt angle (β) of 20 degrees at solar noon.
Assume the sun is perfectly aligned with the panel's azimuth, and the solar zenith angle (θz) is 30 degrees. This makes the angle of incidence (θ) on the panel 10 degrees.
We will use a direct normal irradiance (DNI) of 900 W/m², a diffuse horizontal irradiance (DHI) of 100 W/m², and a ground albedo (ρ) of 0.2.
1. First, calculate the direct beam component on the tilted surface:
Ebeam = 900 x cos(10°) ≈ 886.3 W/m²
2. Next, using a simple isotropic model, calculate the diffuse sky component:
Ediffuse = 100 x [(1 + cos(20°)) / 2] ≈ 97.0 W/m²
3. Then, calculate the ground-reflected component. This requires knowing the global horizontal irradiance (GHI), which is approximately 879.4 W/m² in this scenario:
Ereflected = 879.4 x 0.2 x [(1 - cos(20°)) / 2] ≈ 5.3 W/m²
The total Global Tilted Irradiance (GTI) is the sum of these three components, yielding approximately 988.6 W/m².
By completing these solar irradiance measurements for specific locations and timeframes, developers can then use them as foundational knowledge for critical system design choices, such as stringing, sizing, and the optimal DC/AC ratio, in line with project requirements.
Key takeaways for developers:
Model Selection: Anisotropic models are preferred for utility-scale sites as they account for horizon brightening.
Physics-Based Ray Tracing: Use ray tracing for complex topographies where traditional mathematical formulas fail.
Seasonal Variation: Account for the Earth's elliptical orbit (d) to prevent seasonal yield discrepancies.
How to measure solar irradiance
Summary
Physical measurement requires ISO 9060 classified sensors. Pyranometers measure total hemispherical radiation, while pyrheliometers track direct beams. Portable meters and reference cells allow for rapid field verification and real-time performance ratio (PR) monitoring during system testing.
While mathematical calculations provide essential guidance, physical measurement instruments are necessary to capture the exact conditions on the ground.
Pyranometers and pyrheliometers
Pyranometers are the standard, primary instruments used to measure Global Horizontal Irradiance (GHI), including both direct beam and diffuse sky radiation. They can also be mounted at an angle to measure Global Tilted Irradiance (GTI).
By using a thermopile sensor, pyranometers translate temperature differences created by solar radiation from the hemisphere into relevant solar irradiance units.
To measure Direct Normal Irradiance (DNI), engineers use pyrheliometers. These sensors also use a thermopile sensor in a similar way, but they must be mounted to a solar tracker to precisely follow the Sun’s trajectory.
Both sensors are graded against the ISO 9060 classification standard, which categorizes devices into three classes (Class A, B, or C) based on their overall accuracy.
Portable solar irradiance meters
For essential field assessments, handheld irradiance meters can act as an accessible solar irradiance calculator. Portable devices allow technicians to quickly verify calculations and iterate upon optimal tilt angles. Alternatively, reference cells can be used to simulate and extrapolate the wider performance of a system.
Whether using handheld meters or reference cells, irradiance calculations are dependent upon equipment that has been precisely calibrated against known field conditions.
Using measurements for PV system performance
By building dependable measurements, developers can use these as a baseline to test actual performance against, making it easier to determine if a development is meeting its optimal yield potential. This comparative process is essential for troubleshooting underperforming systems and identifying areas for improvement.
Key takeaways for developers
ISO 9060 Standards: Always use Class A sensors for bankable, high-precision resource assessments.
Maintenance: Sensors must be cleaned and calibrated regularly to prevent "soiling" from skewing baseline data.
Reference Cells: Use reference cells to match the specific spectral response of your chosen PV technology.
What affects solar irradiance at your location?
Summary
Irradiance is influenced by latitude, altitude, and localized climate patterns. However, high-irradiance zones often face "Basis Risk" and grid constraints; successful developers must balance raw solar potential against locational marginal pricing and interconnection feasibility.
Total solar energy potential is dictated not only by geographical and climate constraints, but by the challenging realities of large-scale solar development.
Geographic and climate factors
Geography is, of course, a major factor in irradiance levels. Latitude determines the sun’s angle, with higher latitudes receiving less intense sunlight compared to latitudes nearer the equator.
Altitude also plays a vital role in site assessment, as higher elevations offer thinner atmospheric conditions and thus more direct solar irradiance with less diffusion.
Those are the basic considerations, but geographic baselines are heavily influenced by localized meteorological conditions, which are also subject to dramatic seasonal variations.
While identifying sites that offer the greatest solar irradiance to power generation might seem like the primary driver in site selection, the reality is that higher irradiance zones typically coincide with lower energy market pricing and an all-around more competitive solar landscape.
Developers must study locational marginal pricing as part of their basis risk analysis to identify areas where energy produced will generate the highest financial return: balancing raw power generation against grid economics.
Solar irradiance by region
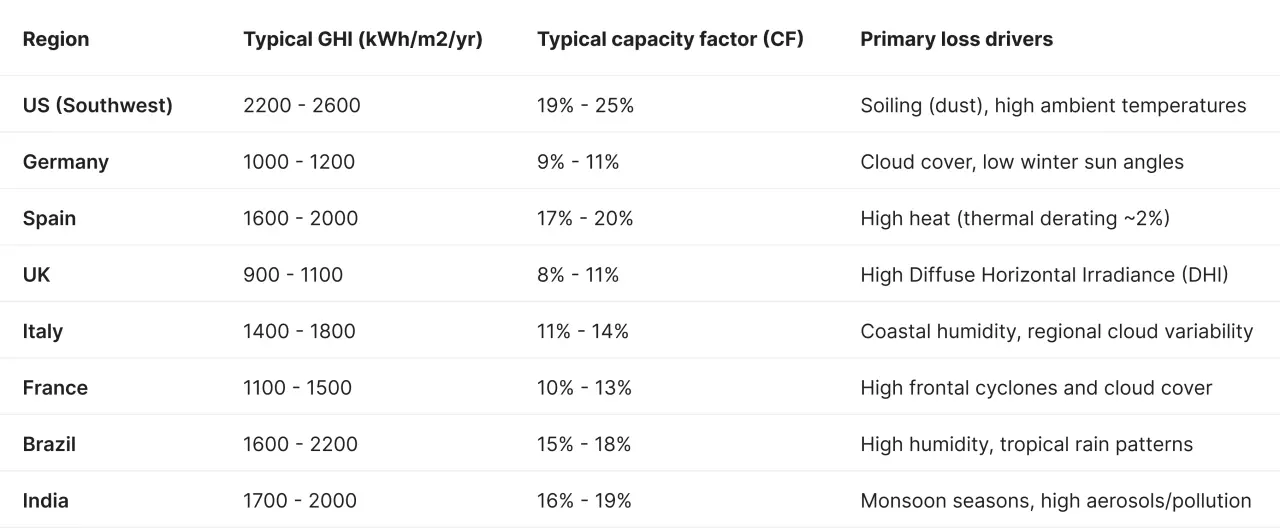
Global solar irradiance data by region, illustrating the key metrics used in a solar irradiance calculator to determine Typical GHI ($kWh/m^2/yr$) and Capacity Factors across various climates.
Finding irradiance data for your site
To accurately calculate irradiance data per location, project developers rely on a broad bank of established meteorological databases. The Global Solar Atlas represents an excellent starting point, with high-quality solar maps and resources designed to support the scale-up of solar power in represented countries.
The NASA Prediction of Worldwide Energy Resources (POWER) project also provides free, satellite-derived solar and meteorological data based on extensive historical records. More platforms like PVGIS from the European Union and NLR from the United States offer free tools made to assist with accurate energy yield projections and site assessments.
For bankable financial models, developers should ideally utilize at least two independent high-quality satellite datasets (e.g., SolarGIS, Meteonorm, or Vaisala) to cross-verify the Mean Bias Error (MBE) before finalizing projections.
While securing a site with high peak sun hours is important, it is only one piece of the puzzle. Project success depends upon rigorous feasibility assessments. Buildable area analysis, interconnection potential, and environmental constraints are just a few of the many factors that shape early-stage projects.
Even if the average solar irradiance is higher than at other sites, a project can quickly become an expensive cost sink if the economics and practicalities of development do not make sense.
Key takeaways for developers
Atmospheric Thickness: Higher altitudes offer lower diffusion and higher direct irradiance.
Data Verification: Cross-verify satellite data (e.g., NASA, SolarGIS) with on-site ground measurements for MBE (Mean Bias Error).
Grid Economics: A high-irradiance site may be unviable if grid curtailment or low energy pricing devalues the yield.
Solar irradiance to power: Designing your PV system
Summary
Converting irradiance to AC power involves factoring in panel efficiency, temperature coefficients, and system losses. Modern modeling utilizes digital twins and bifacial gain calculations to bridge the gap between Standard Test Conditions (STC) and real-world field performance.
Transforming raw solar irradiance calculations into a functional PV system requires precise modeling and a deep understanding of how practical factors augment theoretical efficiencies.
Sizing a system based on irradiance data
Designing a solar farm starts by working backwards from energy production targets to identify an appropriate site, project sizing, and technological investments that are collectively able to meet project requirements.
From there, engineers can use site-specific data to determine the optimal placement and tilt angle for maximum annual irradiance. This process also requires accounting for seasonal variations to ensure a site can meet its grid commitments and financial targets year-round.
Converting irradiance to electrical output
The basic formula for calculating solar irradiance to power output is:
Irradiance x Area x Efficiency
Panel efficiency is typically calculated under standard test conditions (STC), usually 1,000 W/m2 of irradiance at 25°C, with an air mass (AM) of 1.5. It should be noted that modern utility-scale projects also increasingly include Bifacial Gain in these calculations for more accurate estimations.
Even then, laboratory calculations and standardized tests rarely align with real-world conditions. To bridge the gap, modern simulation tools such as physics-based ray tracing and digital twin modeling are employed to stress-test lab ratings under real-world conditions, long before construction begins.
When presenting a project to investors, the output is not simply presented as instantaneous capacity. Instead, specific yield (kWh/kWp/year) captures the total AC energy the plant is expected to generate annually per unit of installed capacity. In doing so, the Performance Ratio of a project can be better calculated. Bankable PR assessments must also exclude external constraints like clipping and grid-enforced curtailment.
Bifacial gain
Modern utility-scale bifacial modules capture reflected irradiance from the rear side that is reflected on the ground (albedo) or other surfaces, which is a critical calculation to account for when it comes to accurate power modeling on complex or high-albedo terrain. It also requires specific physics-based modeling, especially over topography where rear-side irradiance is non-uniform. Albedo also varies by season and ground cover, and accurate modeling ensures that bifacial gain isn't overestimated in the financial IRR.
Factors affecting conversion efficiency
While baseline technology and efficiency ratings set theoretical conversion limits, real-world output is influenced by a complex web of interrelated environmental and installation variables.
Solar irradiance vs. temperature coefficients is often a substantial factor; higher irradiance typically means higher temperatures, which means lower panel conversion efficiency. Typically, solar panels experience a 0.3-0.5% loss per °C of cell temperature above the 25°C STC baseline.
Engineers must also calculate for inverter efficiency and shading losses. As shading losses are never uniform throughout a plant, modelling must account for variation at the individual module level for true accuracy.
To present a bankable energy assessment to investors, developers also compile comprehensive reports that identify thermal, soiling, and cabling losses aimed at translating theoretical efficiencies into real-world realities. A loss diagram is often used to visualize these factors, clearly illustrating how each loss category, from thermal and soiling to cabling and inverter inefficiencies, impacts the final energy yield.
For a technical deep dive into how these calculations are handled across different platforms, you can view our breakdown of PVcase vs. PVSyst loss modeling.
Key takeaways for developers
Temperature Coefficient: Account for the 0.3–0.5% efficiency loss for every degree above 25°C.
Bifacial Gain: Accurately model rear-side irradiance to avoid overestimating IRR in financial models.
AC/DC Ratios: Use irradiance peaks to determine optimal inverter clipping and string sizing strategies.
Conclusion
Understanding how to measure irradiance is the first step in developing a successful PV project. Accurate initial calculations are essential for optimal site selection, leading system design, and bankable yield projections.
Ultimately, translating raw solar data requires purposeful modeling tools capable of translating theoretical irradiance calculations into real-world outcomes.
That means calculating for electrical and shading losses, automating site layouts and panel orientation, and simulating site performance with advanced physics-based ray tracing and digital twin technology — all of which PVcase Yield provides developers with.